Sales Analytics
Track orders, sales revenue, and business performance
Overview Dashboard

Select Time Period
- •Day / Week / Month: Tap to change time period
- •Navigation Arrows: Use < and > to go back/forward
- •Today / This Week / This Month: Quick jump to current period
View Metrics
- • Total Orders: Total number of orders
- • Total Sales: Total revenue (in Taka)
- • Charts or Cards: Data visualization tabs
Different Views
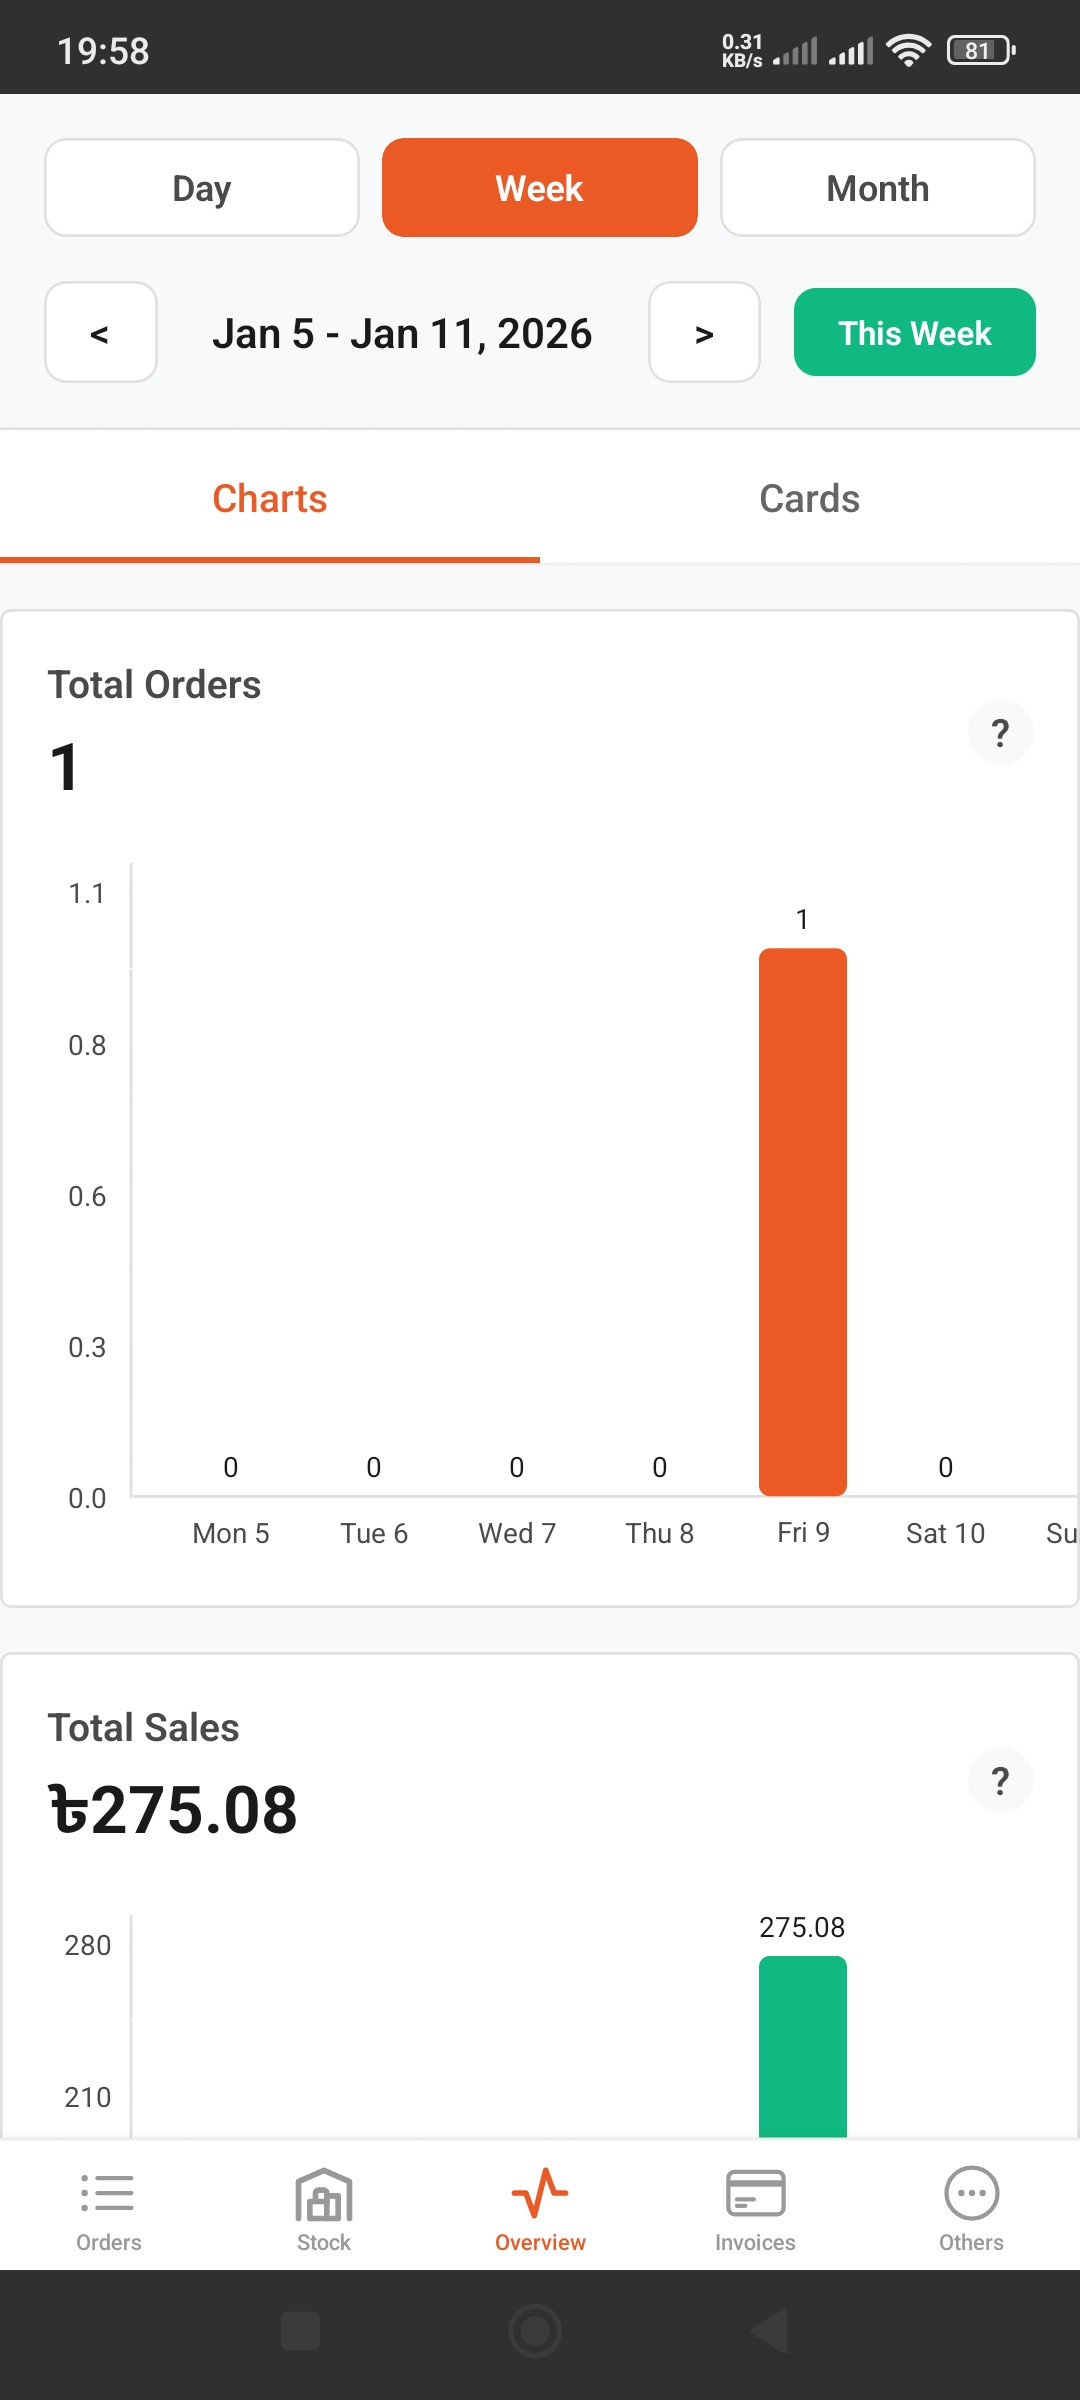
Weekly View
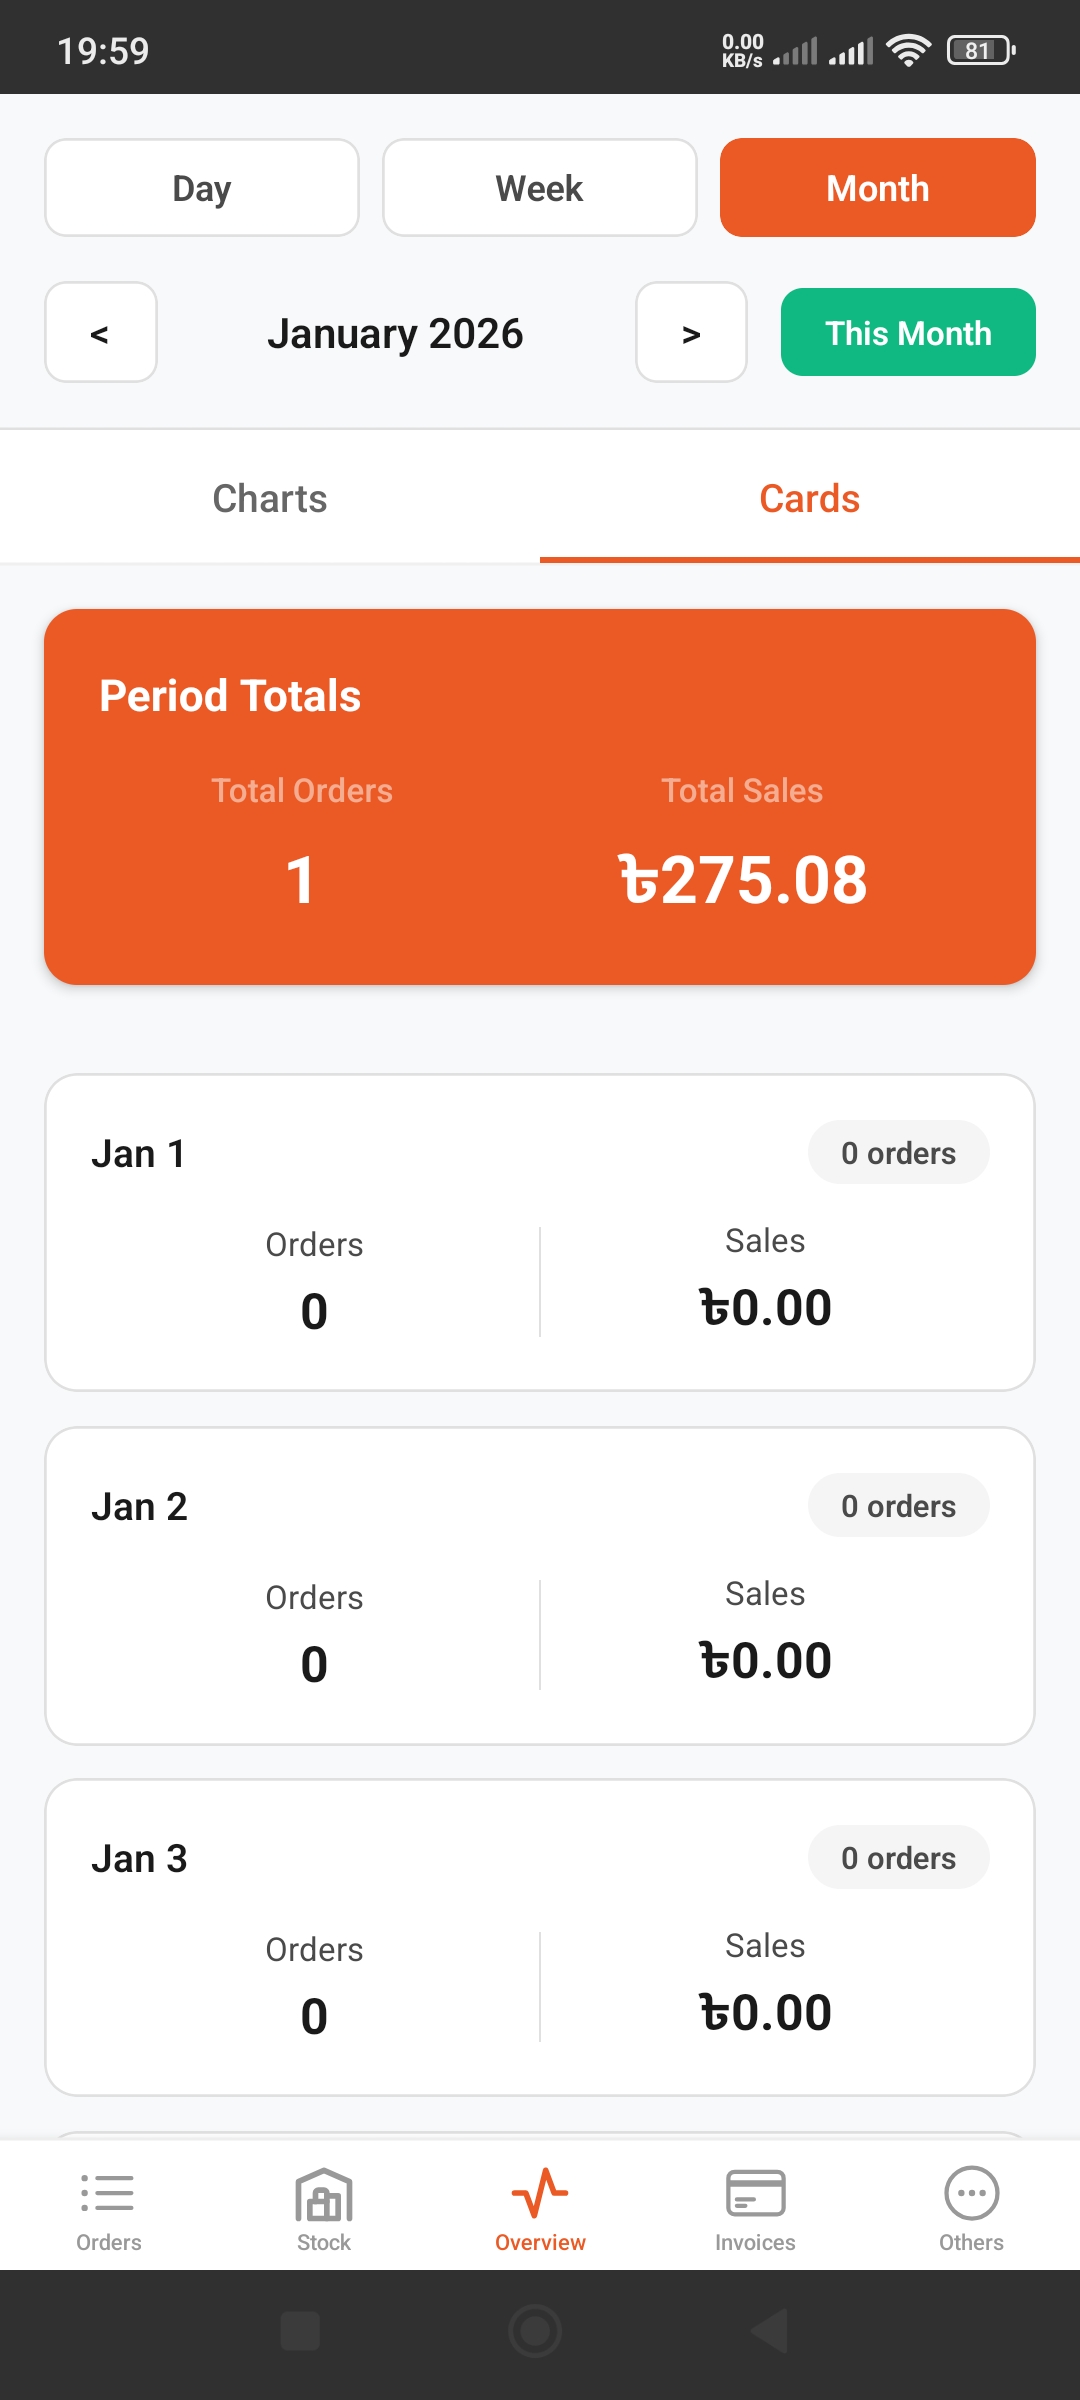
Monthly Cards View
View Types
- •Charts: View data in bar charts
- •Cards: Daily breakdown cards
- •Period Totals: Summary for selected period
Tips
- • Use Day to track daily performance
- • Use Week to see weekly trends
- • Use Month for monthly reports and comparisons